
Document Category: Infographics
-
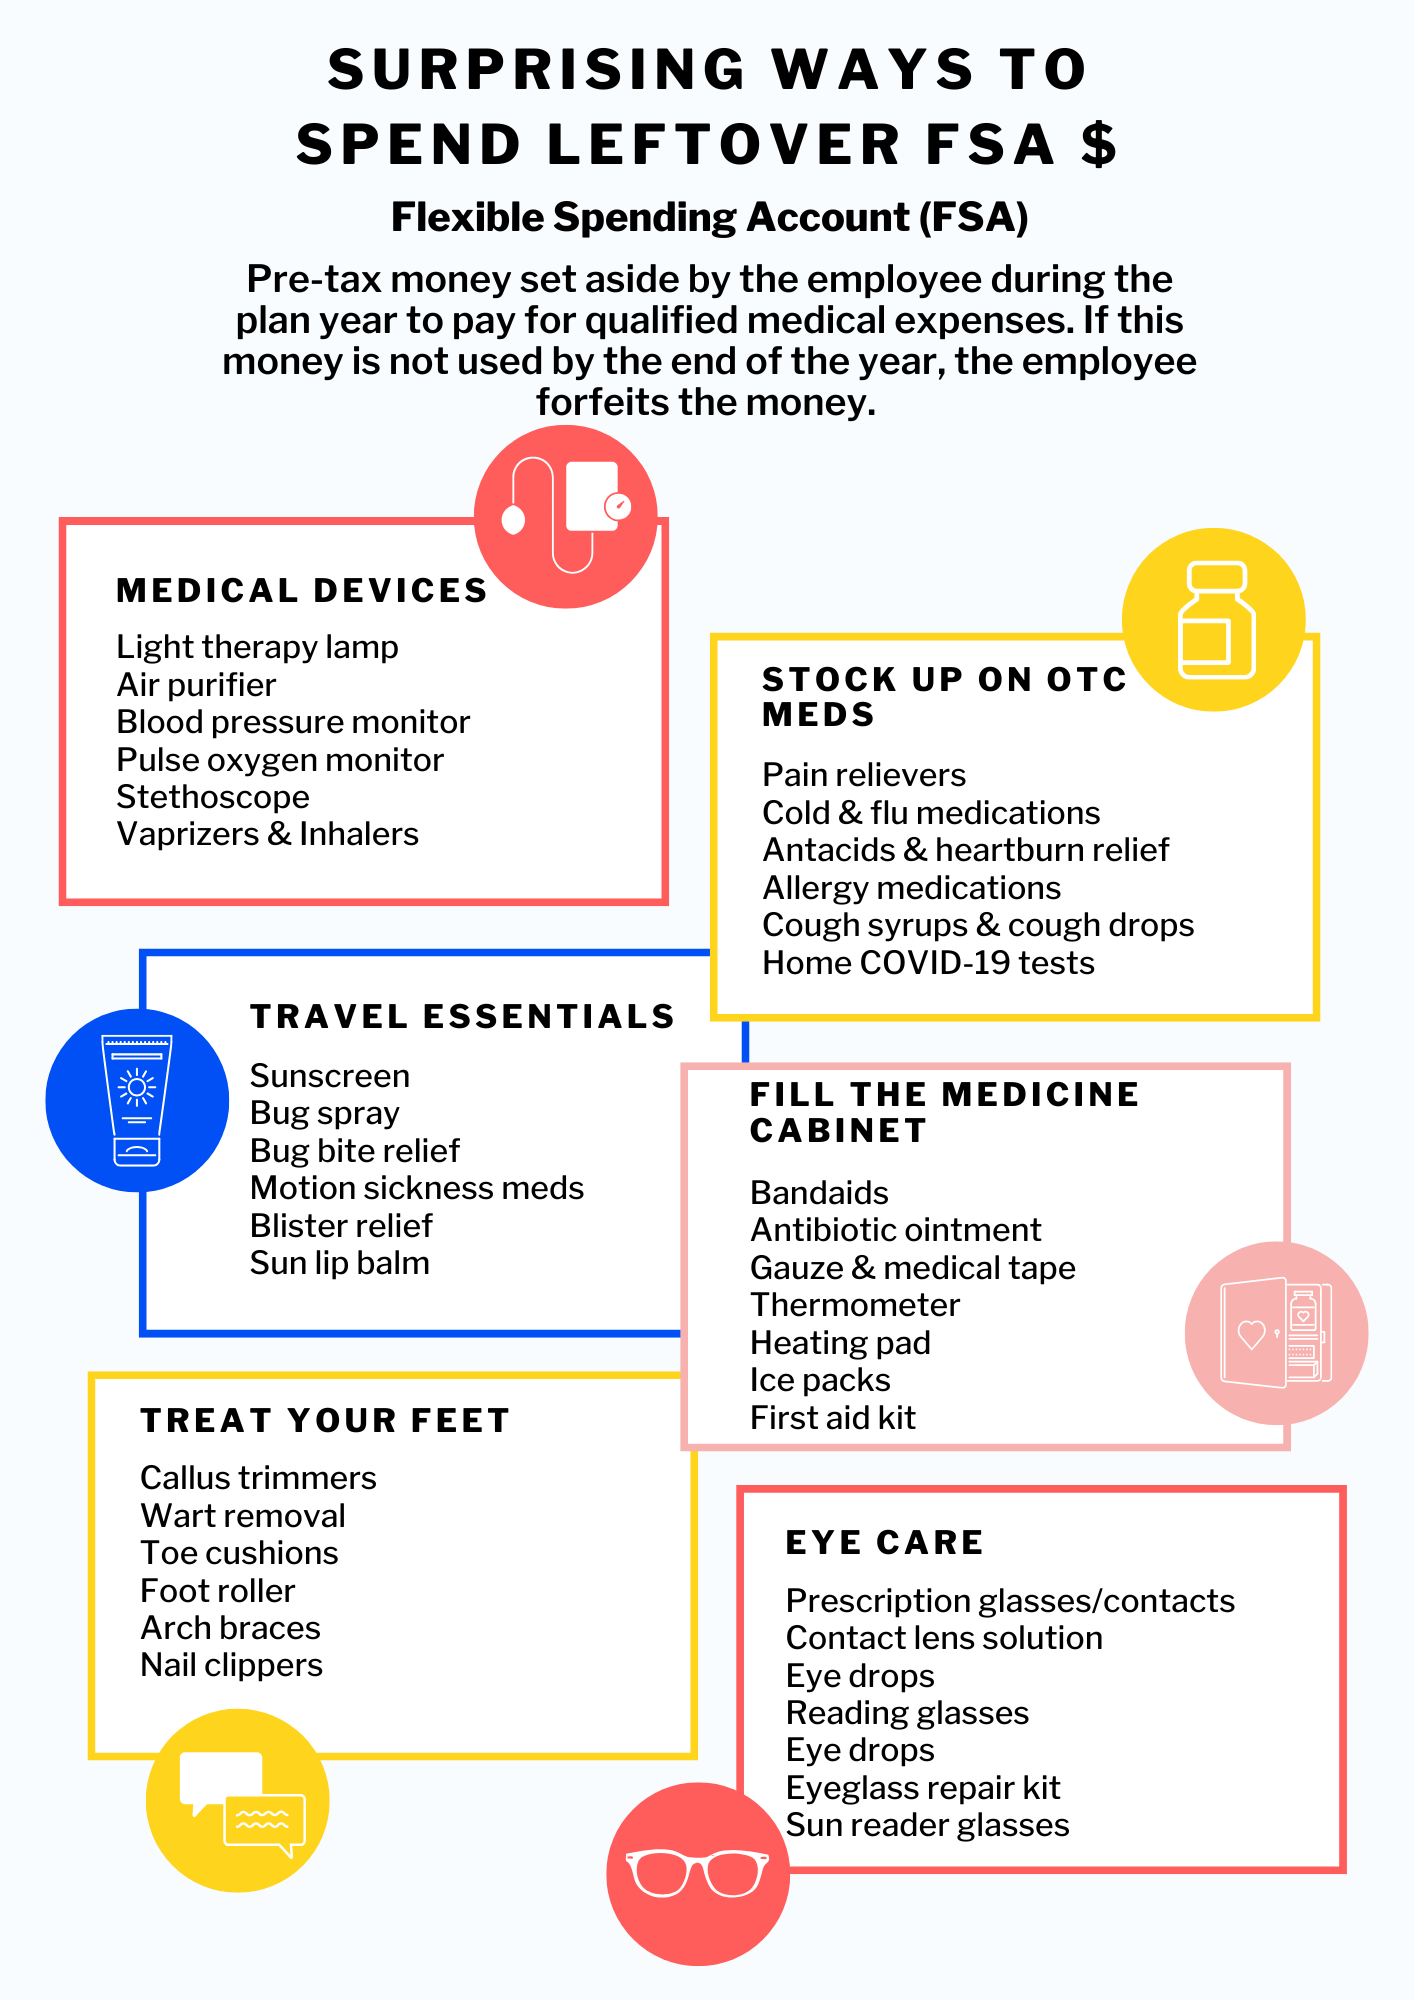
Infographic – Benefits 101: What is an FSA?
Infographic Flexible Savings Accounts – or FSAs – are increasingly popular, but many people don’t know what they actually are or how they work. This infographic breaks down the basics of an FSA. ** Infographics are powerful visual tools that transform complex information or data into easy-to-understand, engaging graphics.
-
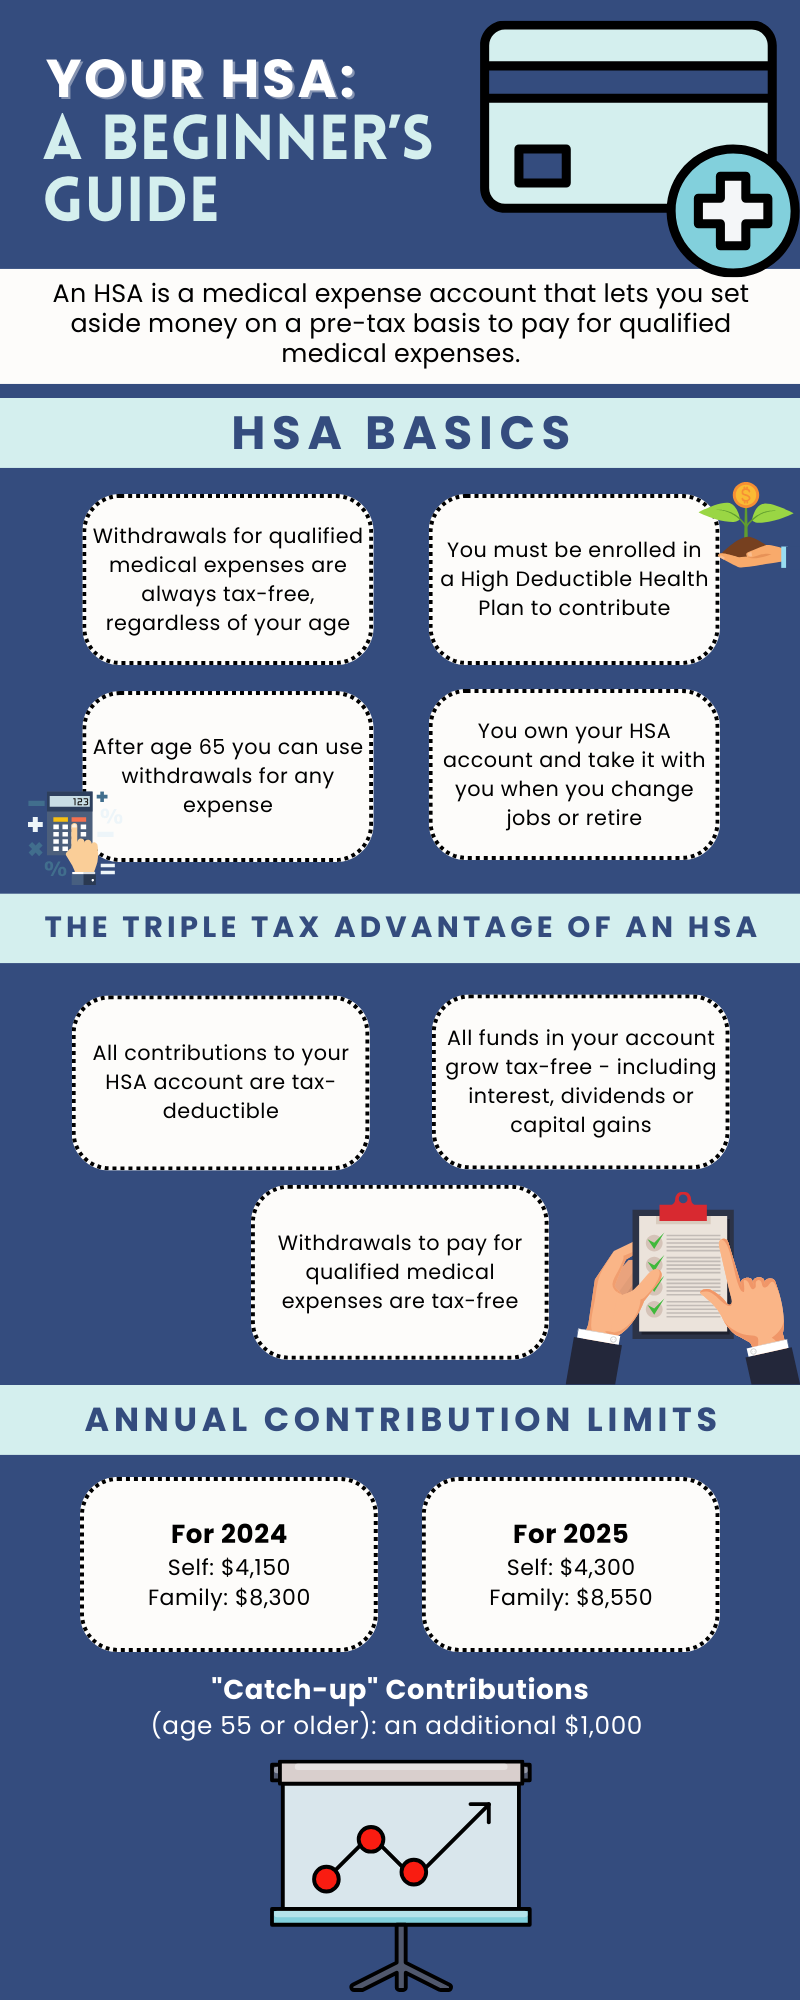
Infographic – Your HSA: A Beginner’s Guide
Infographic Health Savings Accounts (HSAs) are gaining popularity, but many people don’t fully understand them. Our latest infographic explains the basics of HSAs. ** Infographics are powerful visual tools that transform complex information or data into easy-to-understand, engaging graphics.
-

Infographic – Breaking Down Your Benefits: Understanding Key Terms
Infographic Lost in a sea of healthcare jargon? Our latest infographic breaks down the most common employee benefits terms. ** Infographics are powerful visual tools that transform complex information or data into easy-to-understand, engaging graphics.
-
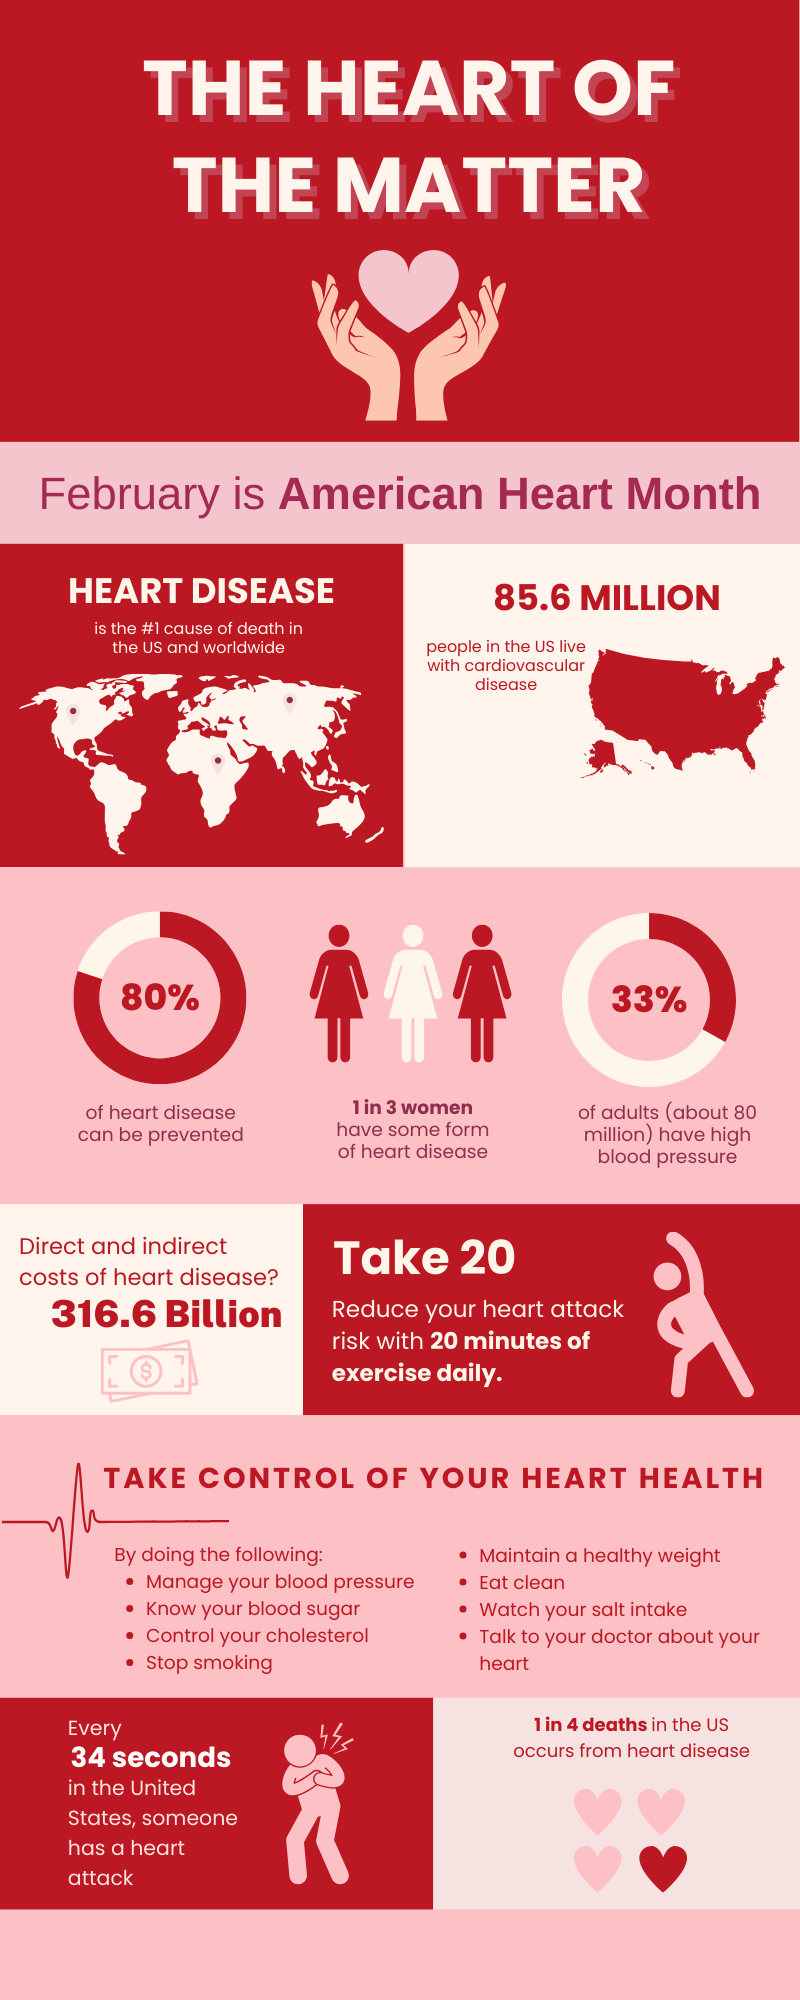
Infographic – The Heart of the Matter: Your Guide to Cardiovascular Wellness
Infographic It’s February – American Heart Month – a time when the nation spotlights heart disease, the #1 killer of Americans. Small daily changes can make a big difference to your heart. Your lifestyle choices have a greater impact on your heart health than your genes. Start today and invest in a healthier future. **…
-
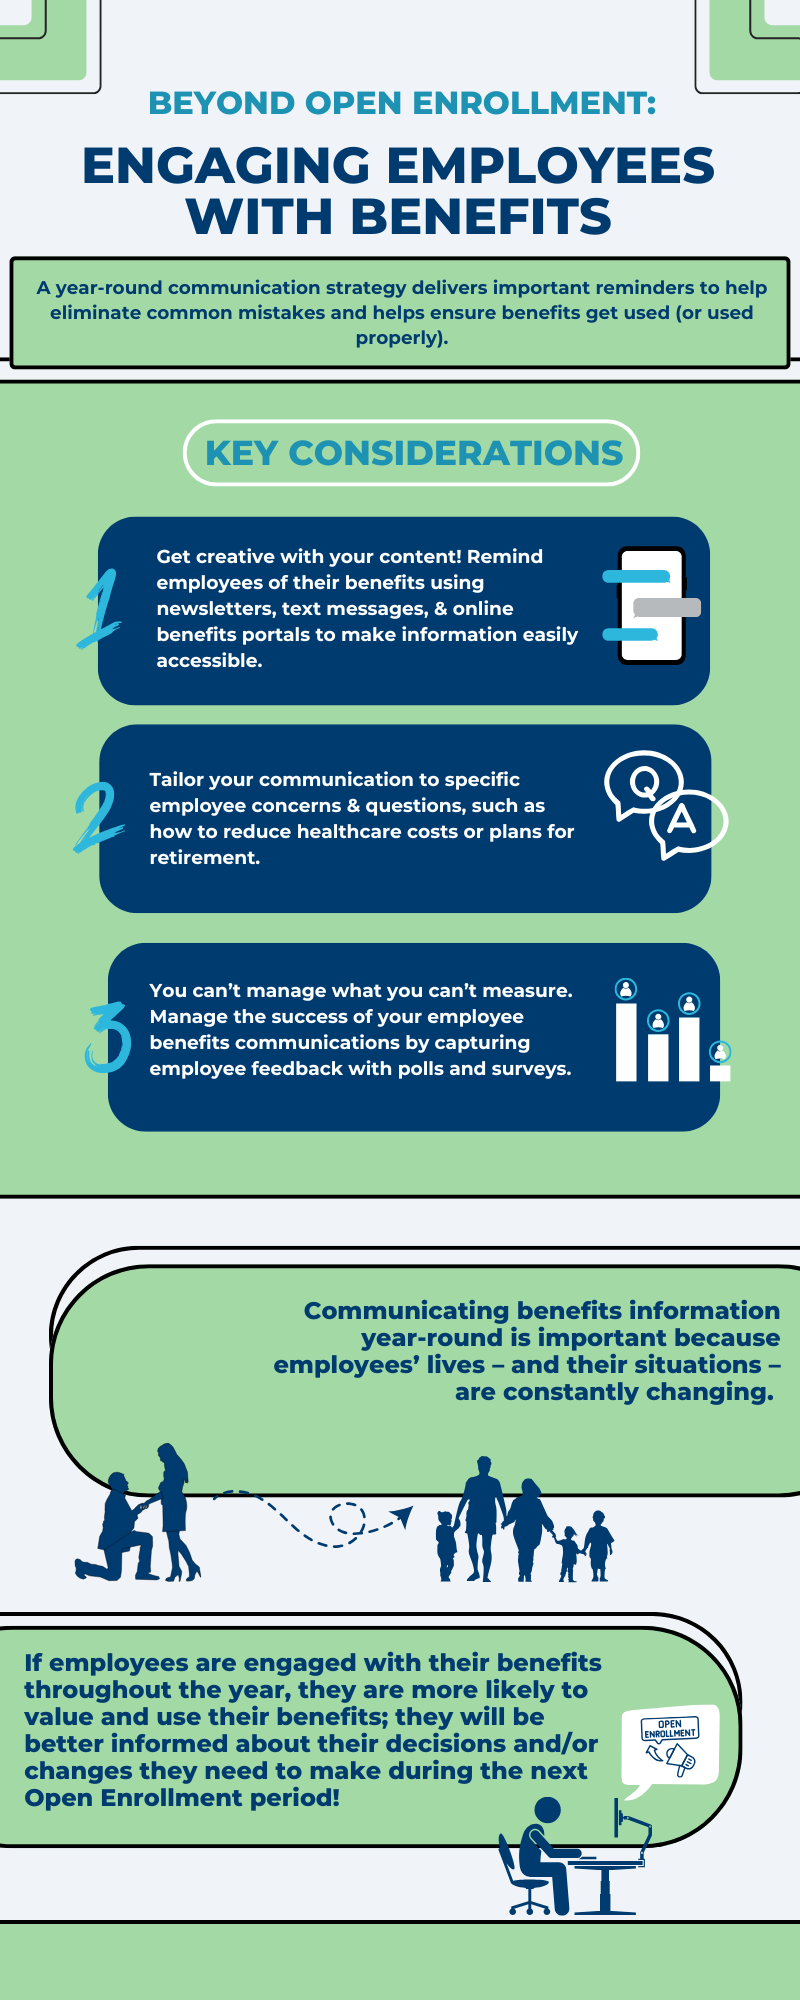
Infographic – Beyond Open Enrollment: Engaging Employees with Benefits
Infographic When was the last time you discussed employee benefit usage with your team? If it was during open enrollment, read our latest infographic for year-round communication tips. Additional versions can be downloaded below: ** Infographics are powerful visual tools that transform complex information or data into easy-to-understand, engaging graphics.
-
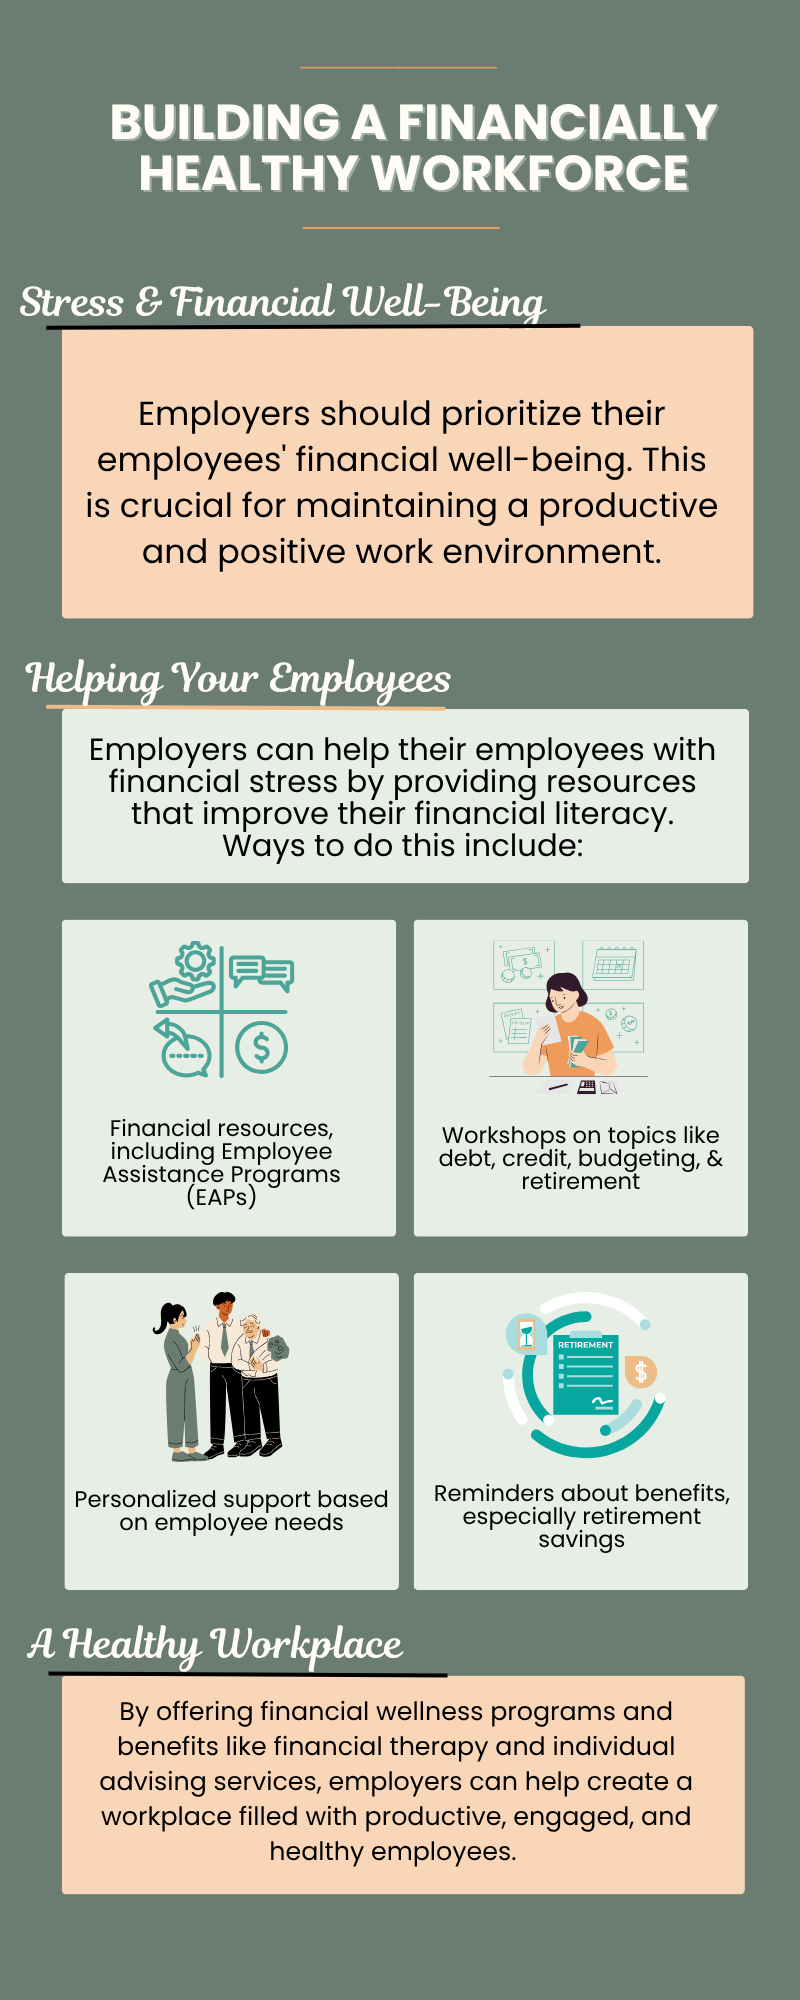
Infographic – Building a Financially Healthy Workforce
Infographic 52% of adults struggle with financial stress. 52% isn’t just a number–it’s your workforce. From budgeting workshops to retirement planning, check out how you can make a real impact! ** Infographics are powerful visual tools that transform complex information or data into easy-to-understand, engaging graphics.
-
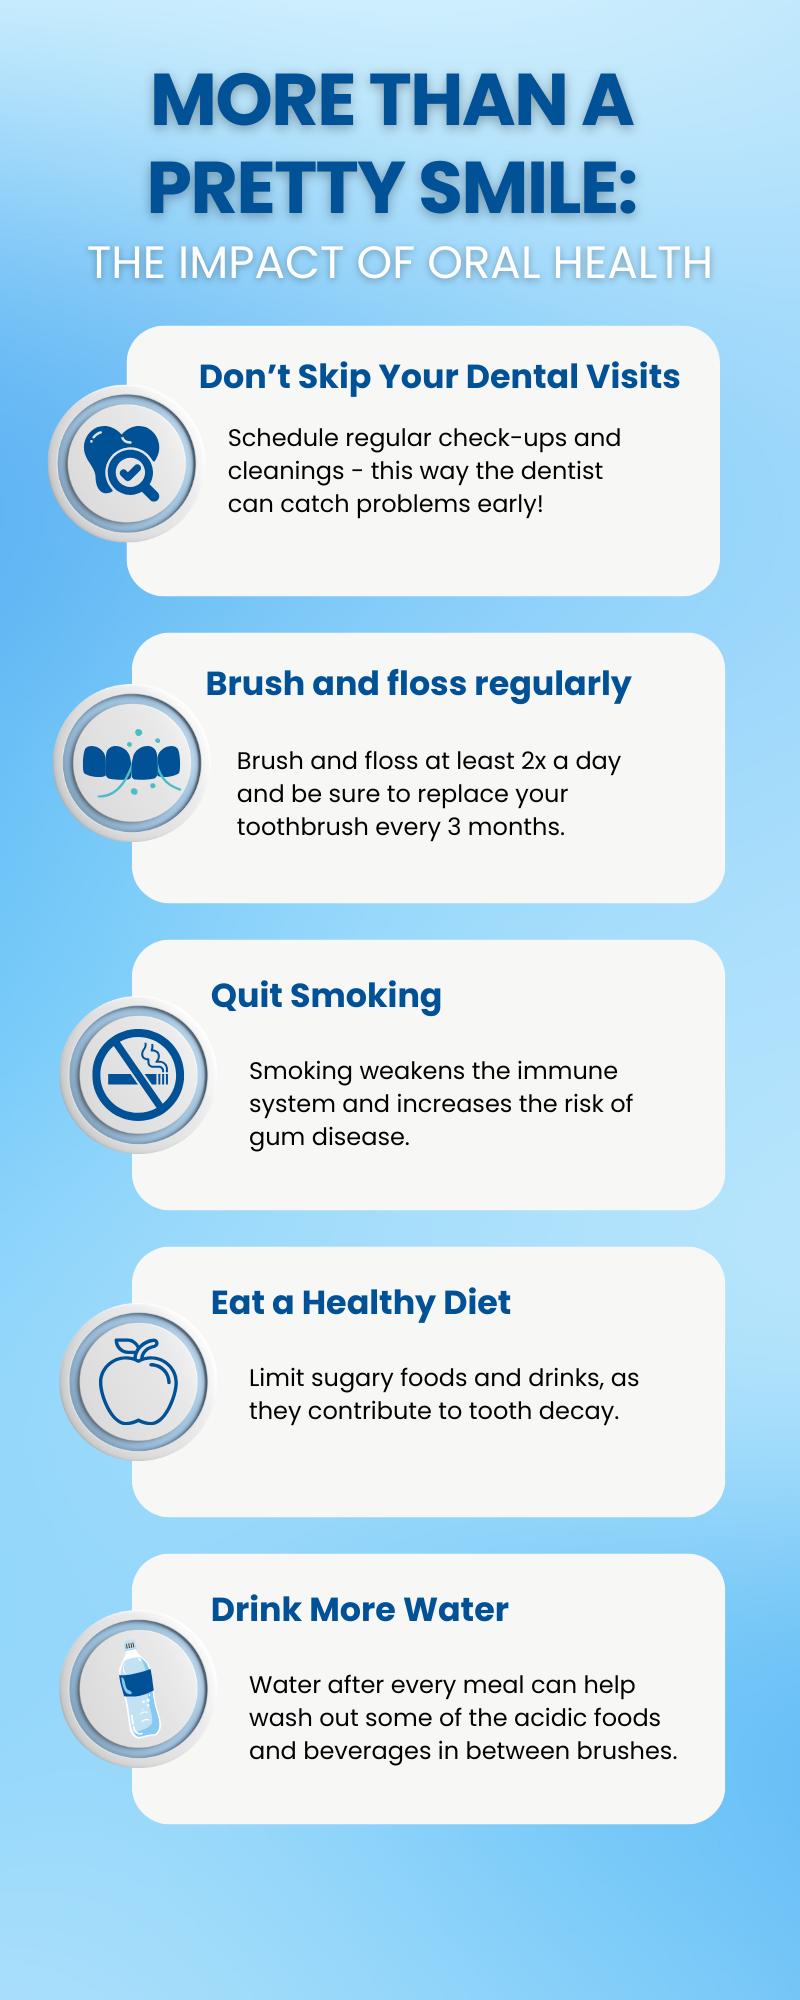
Infographic – More Than Just a Pretty Smile: The Impact of Oral Health
Infographic A healthy smile = A healthier you! Did you know that oral health is linked to heart health, diabetes, and even mental well-being? ** Infographics are powerful visual tools that transform complex information or data into easy-to-understand, engaging graphics.
-
Infographic – Voluntary Benefits: The Missing Piece of Your Compensation Puzzle
Infographic In the ever-evolving landscape of employee benefits, there is a shift in how voluntary benefits are viewed and valued. As workplaces adjust to the evolving needs and expectations of their multi-generational workforces, voluntary benefits are reshaping the benefits landscape. ** Infographics are powerful visual tools that transform complex information or data into easy-to-understand, engaging…
-
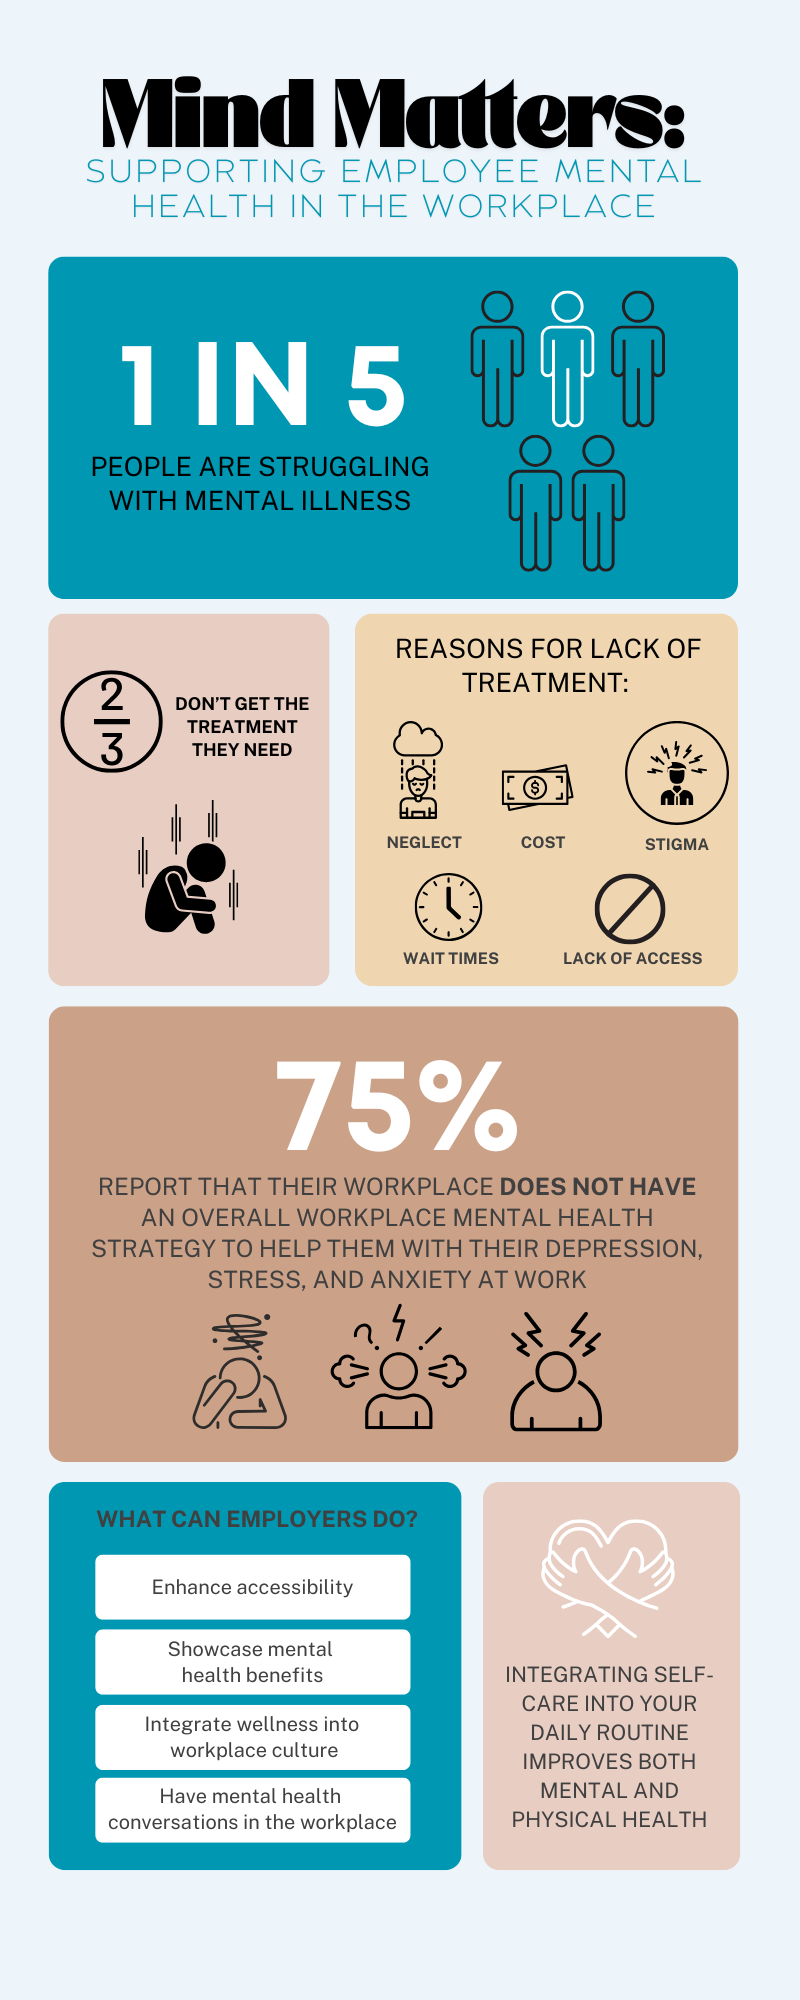
Infographic – Mind Matters: Supporting Employee’s Mental Health at Work
Infographic Open conversations about mental health in the workplace matter. Learn how employers can foster a culture of communication and support. ** Infographics are powerful visual tools that transform complex information or data into easy-to-understand, engaging graphics.
-
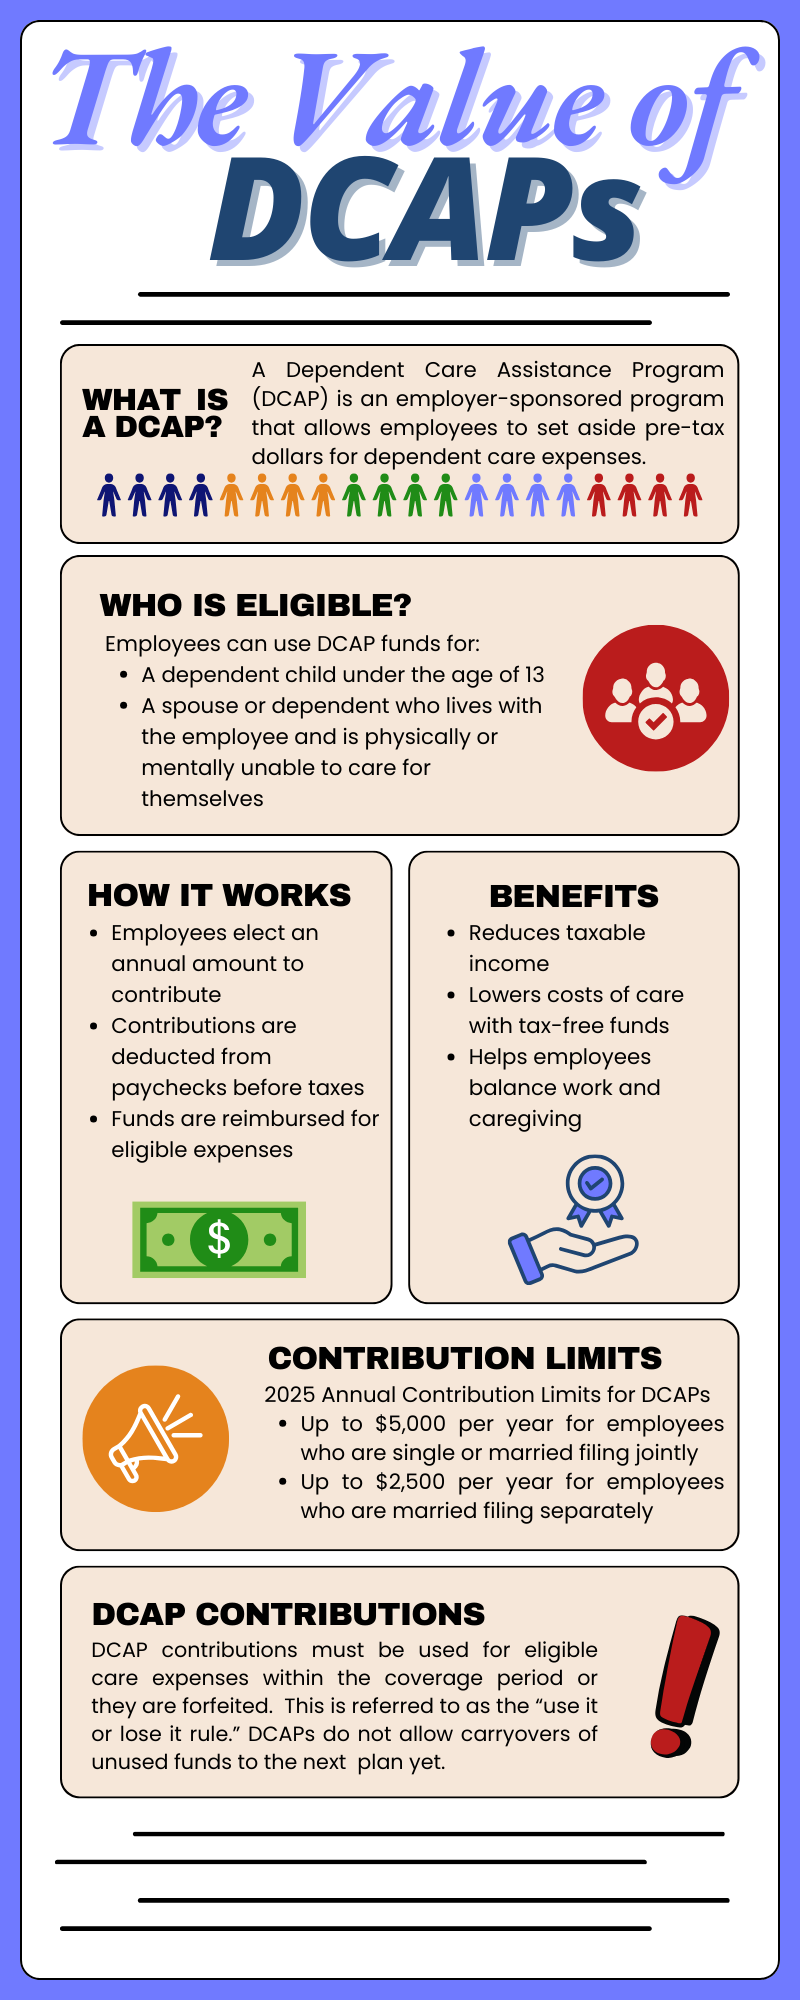
Infographic – Supporting Your Workforce: The Value of DCAPs
Infographic Unlock tax-free savings for your dependent care! Our latest infographic breaks down what a Dependent Care Assistance Program (DCAP) is and how you can use pre-tax dollars for eligible expenses. ** Infographics are powerful visual tools that transform complex information or data into easy-to-understand, engaging graphics.